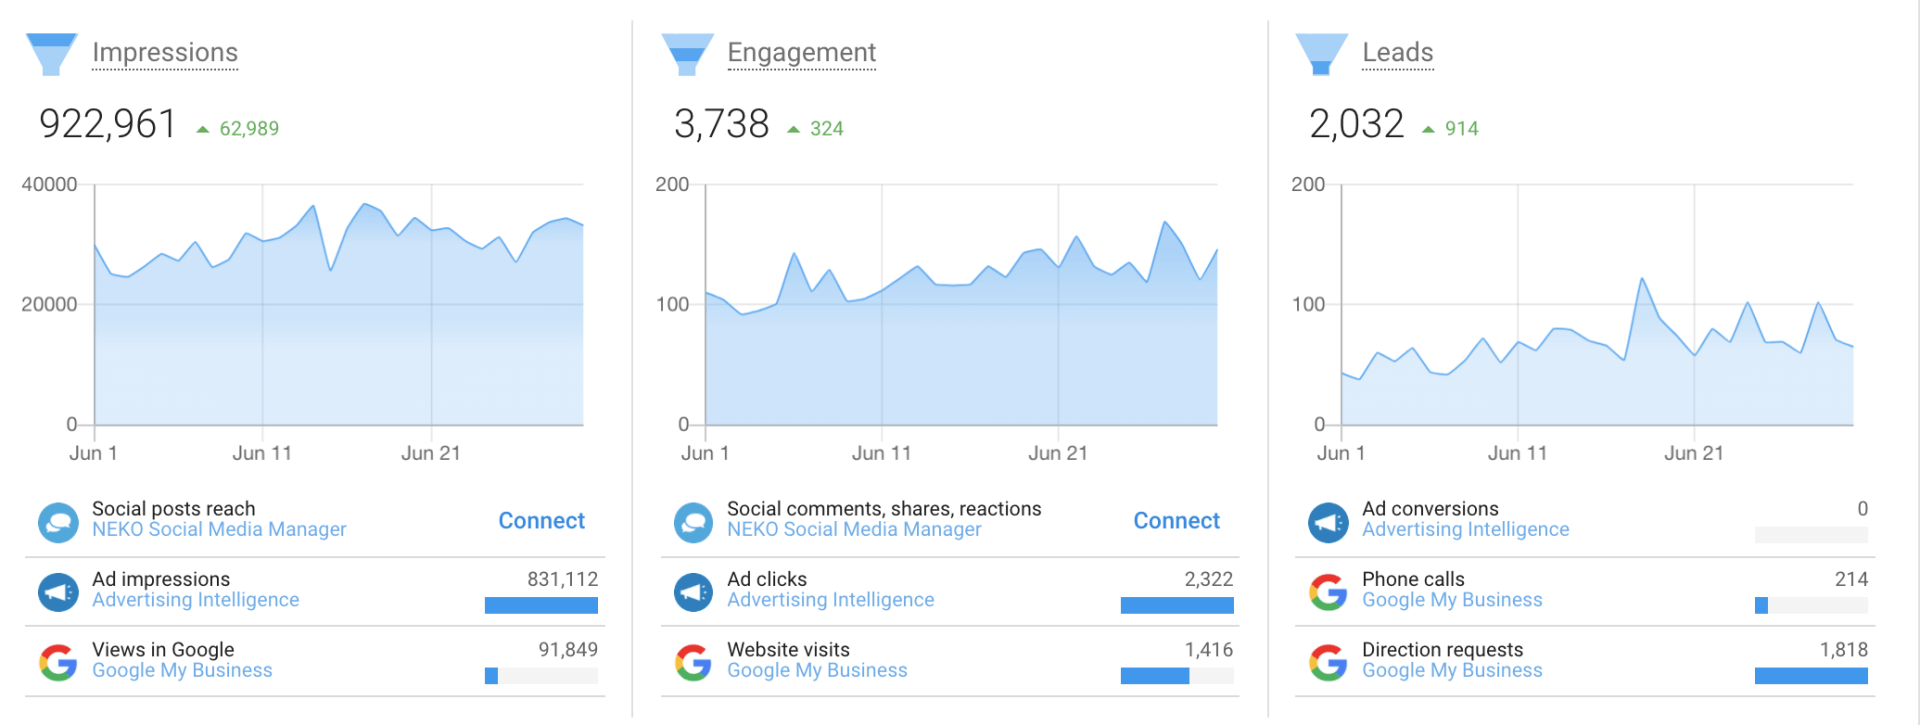
Marketing Funnel
Understand your insights and view the progress of your marketing efforts week by week or month by month.
Listings
Are you listed accurately on search engines, directories, apps, and GPS?
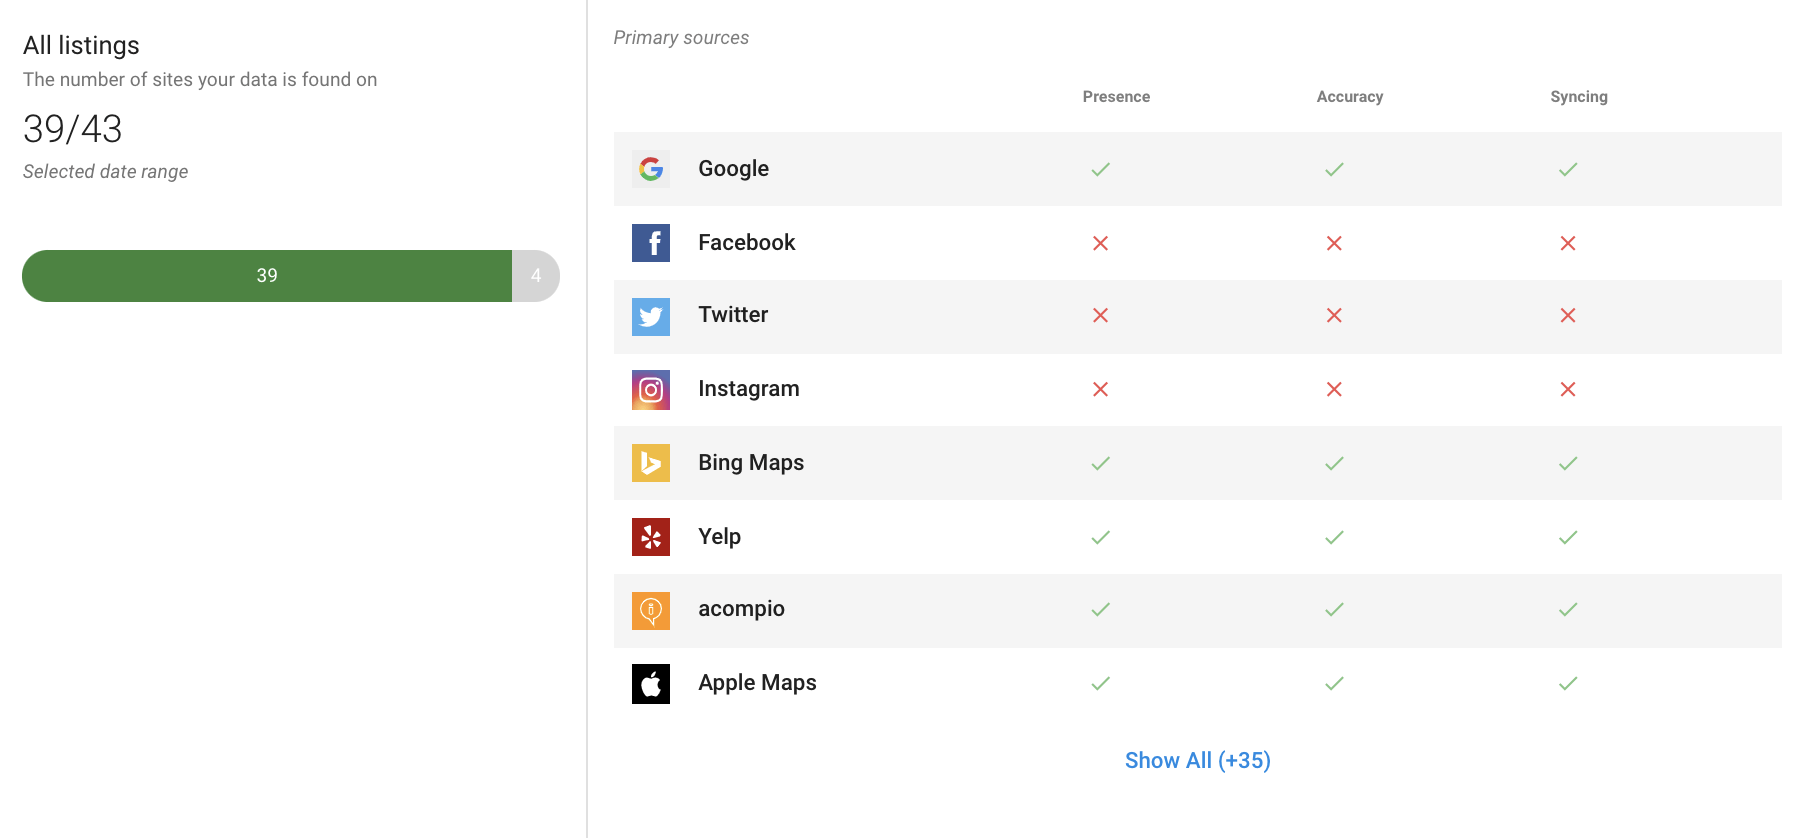
Prevent Inaccurate Business Information
The Executive Report will let you know when and where your listings are showing up accurate and inaccurate across the web.
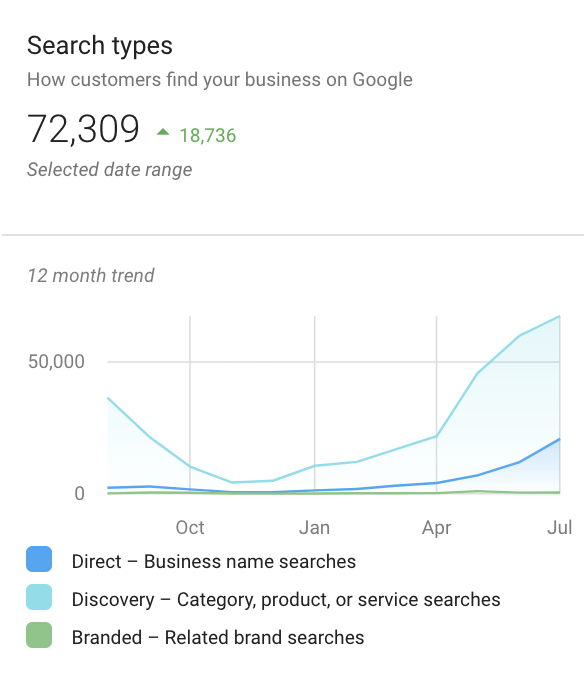
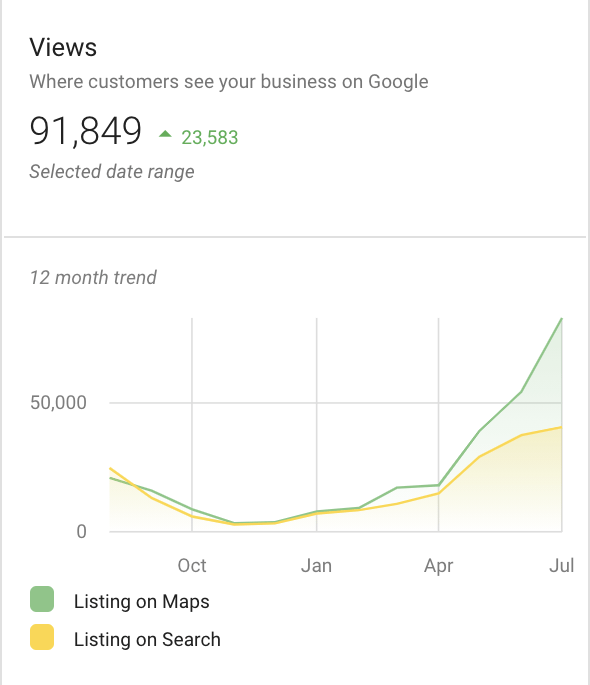
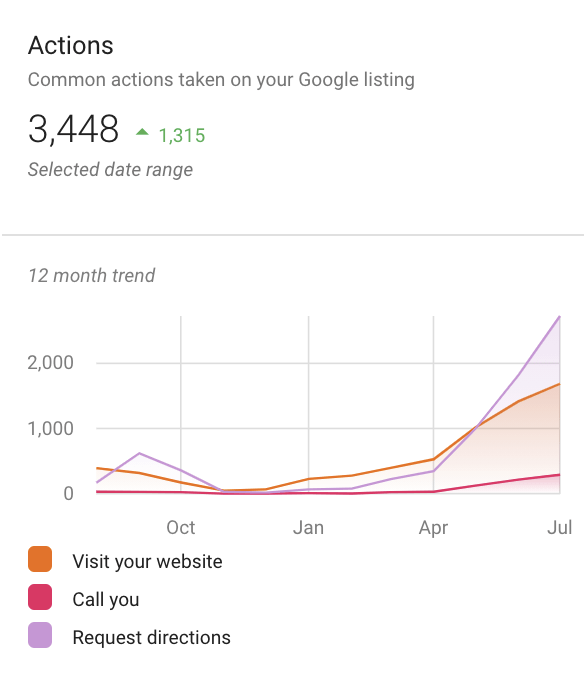
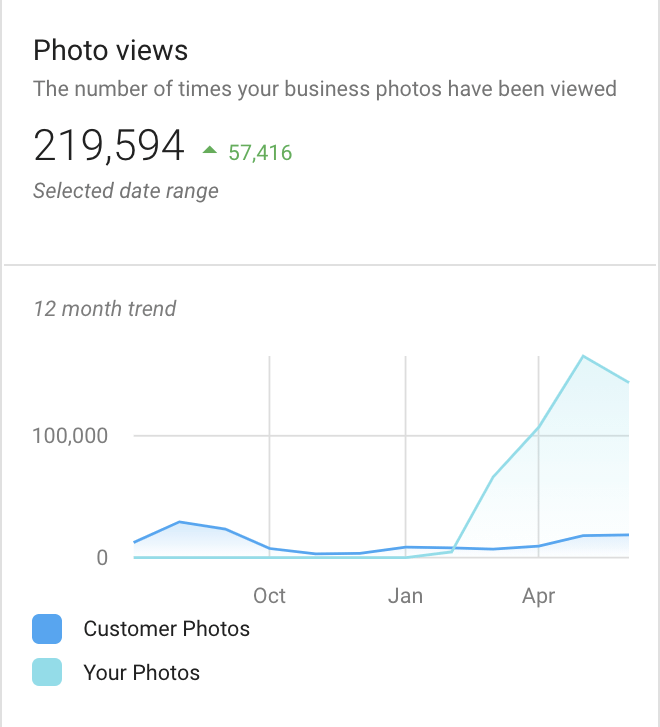
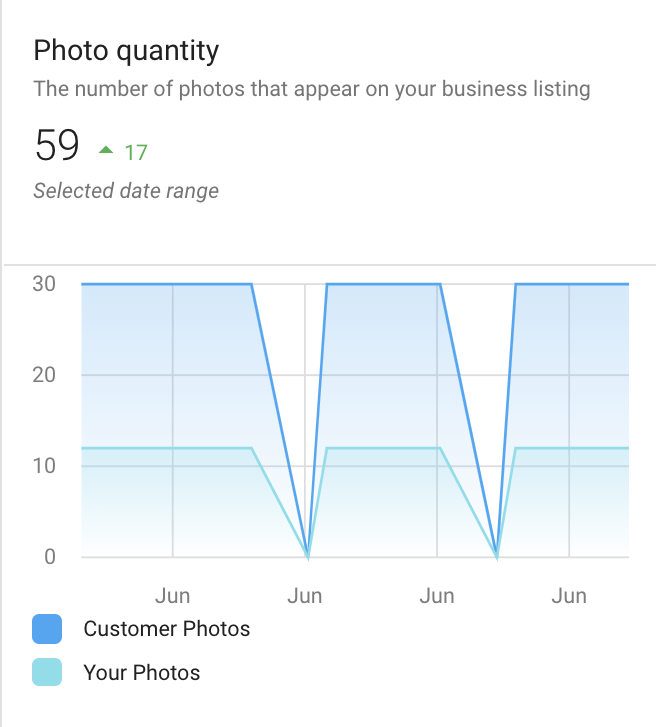
Google My Business
Get detailed insights on how your Google My Business listing is performing to see what's doing well and what needs improvement.
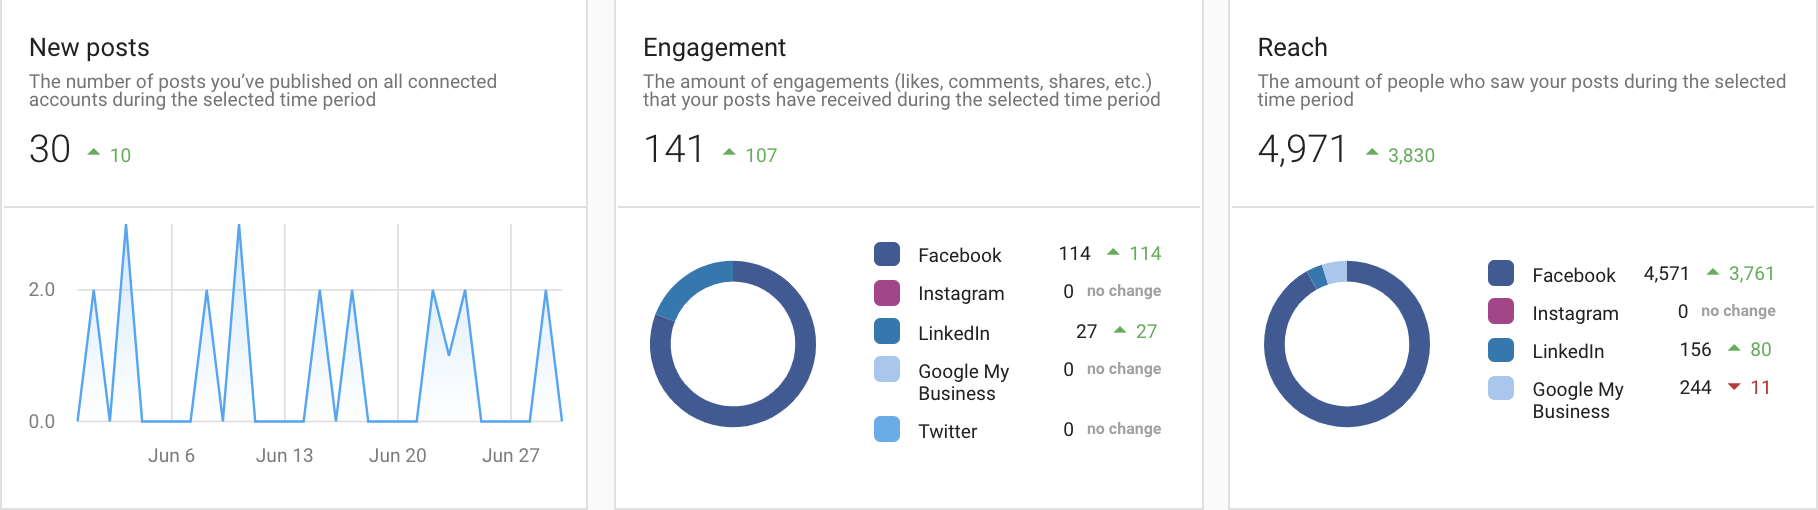
Social
Are you engaging with your community & customers online?
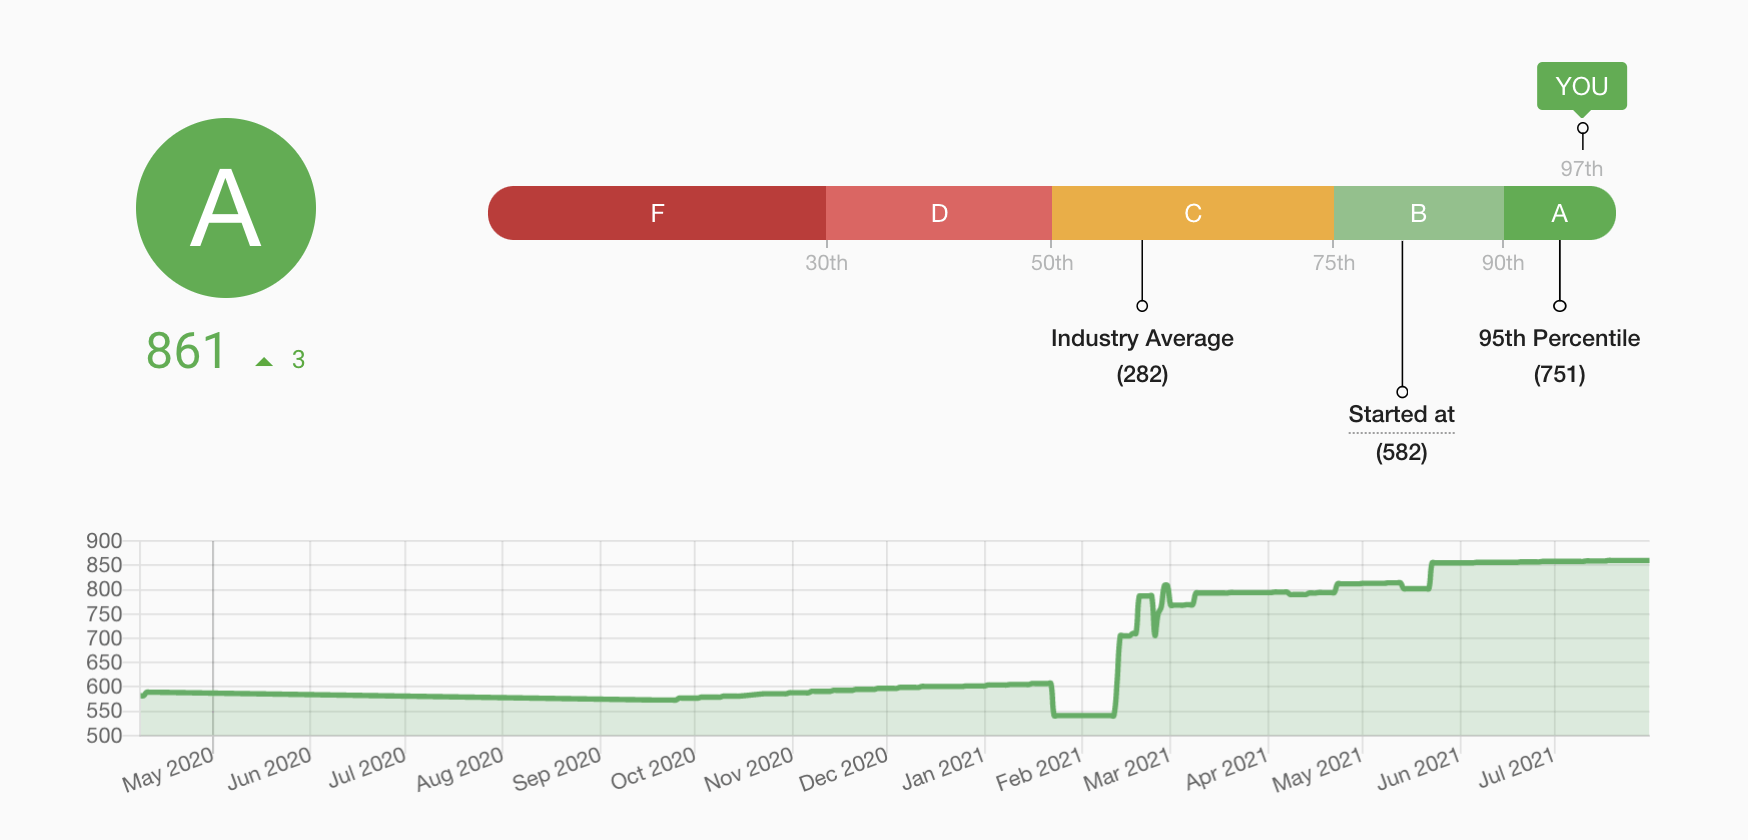
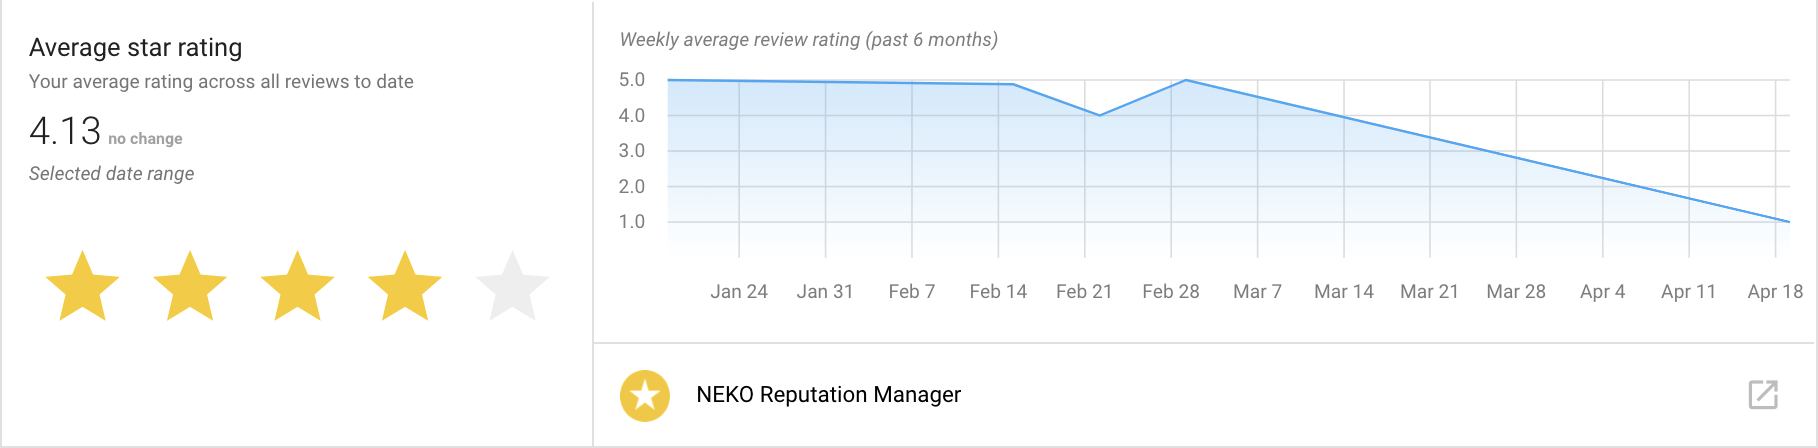
Reputation
Are you reaching everyone?
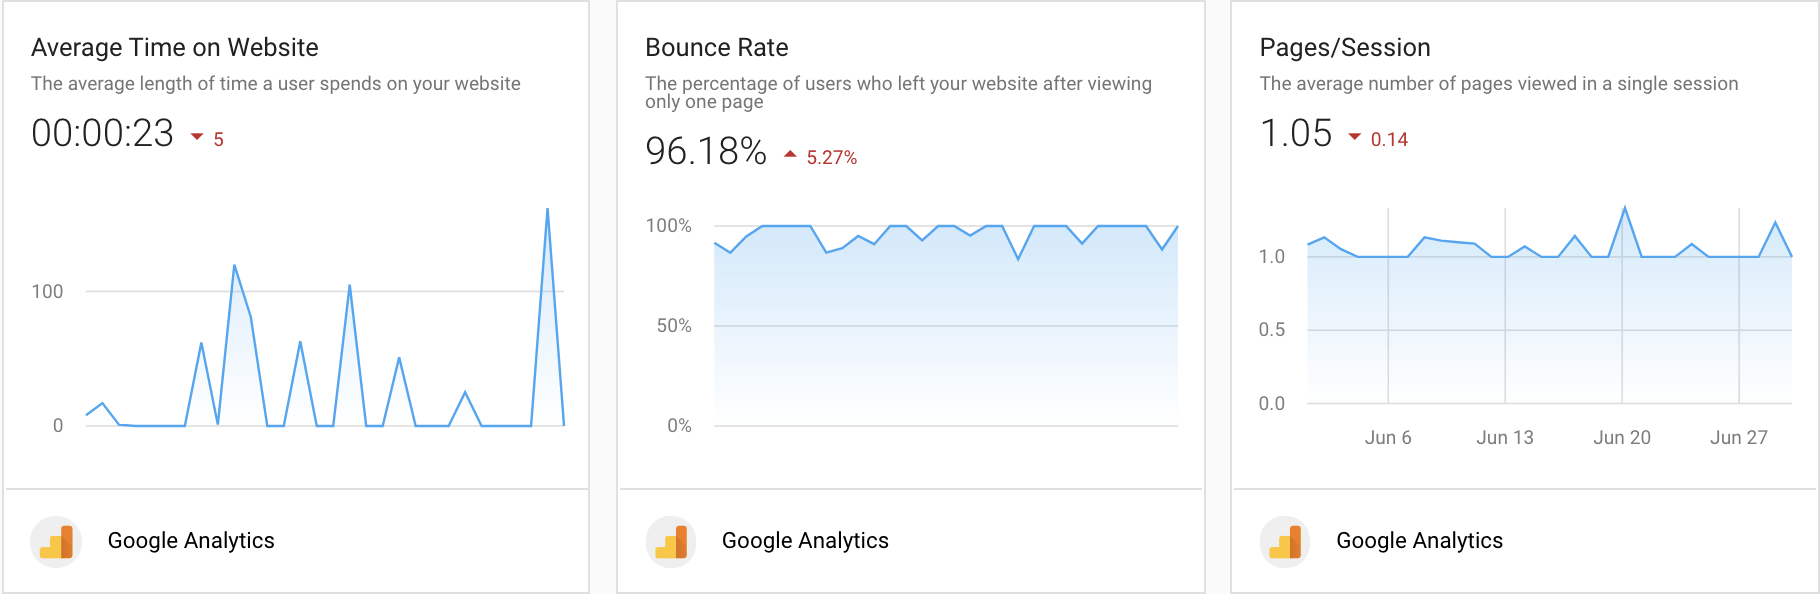
Website
Is your website attracting potential customers?
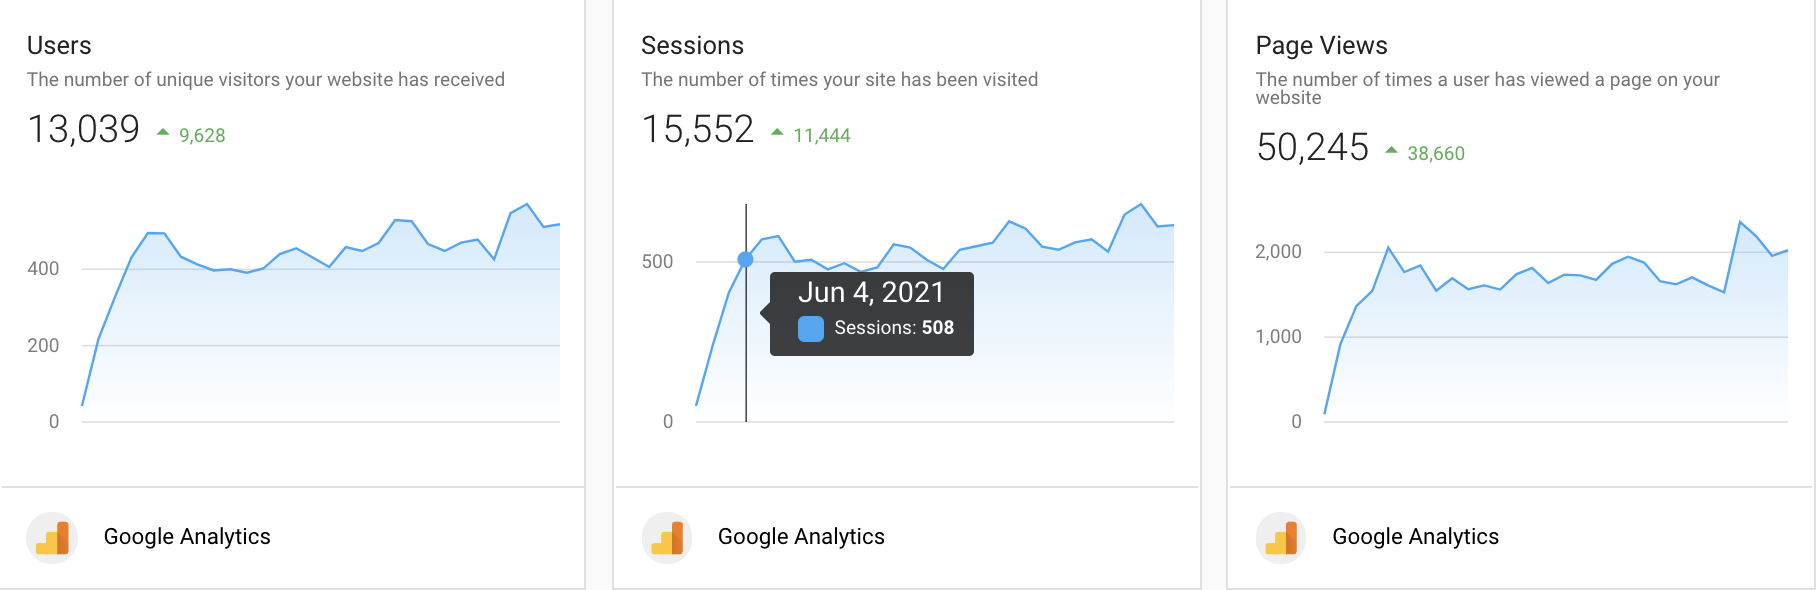
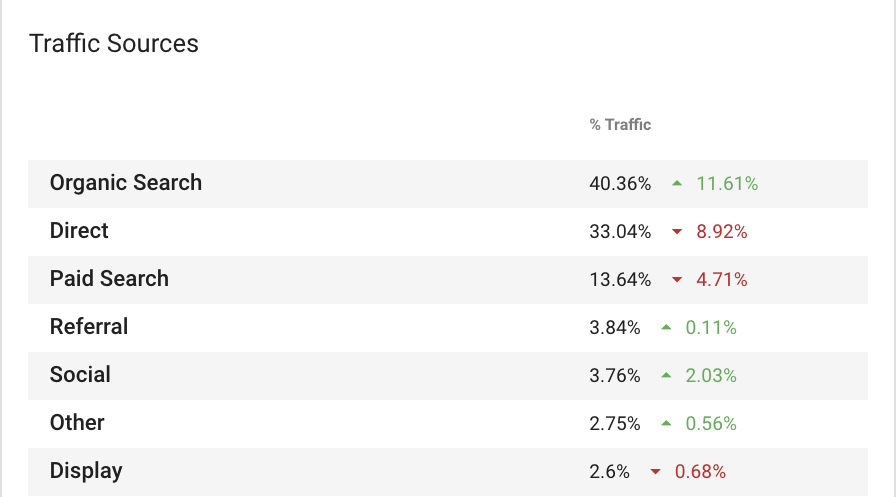
View Your Traffic Sources
Know how your audience finds you so you can spend your marketing budget wisely.
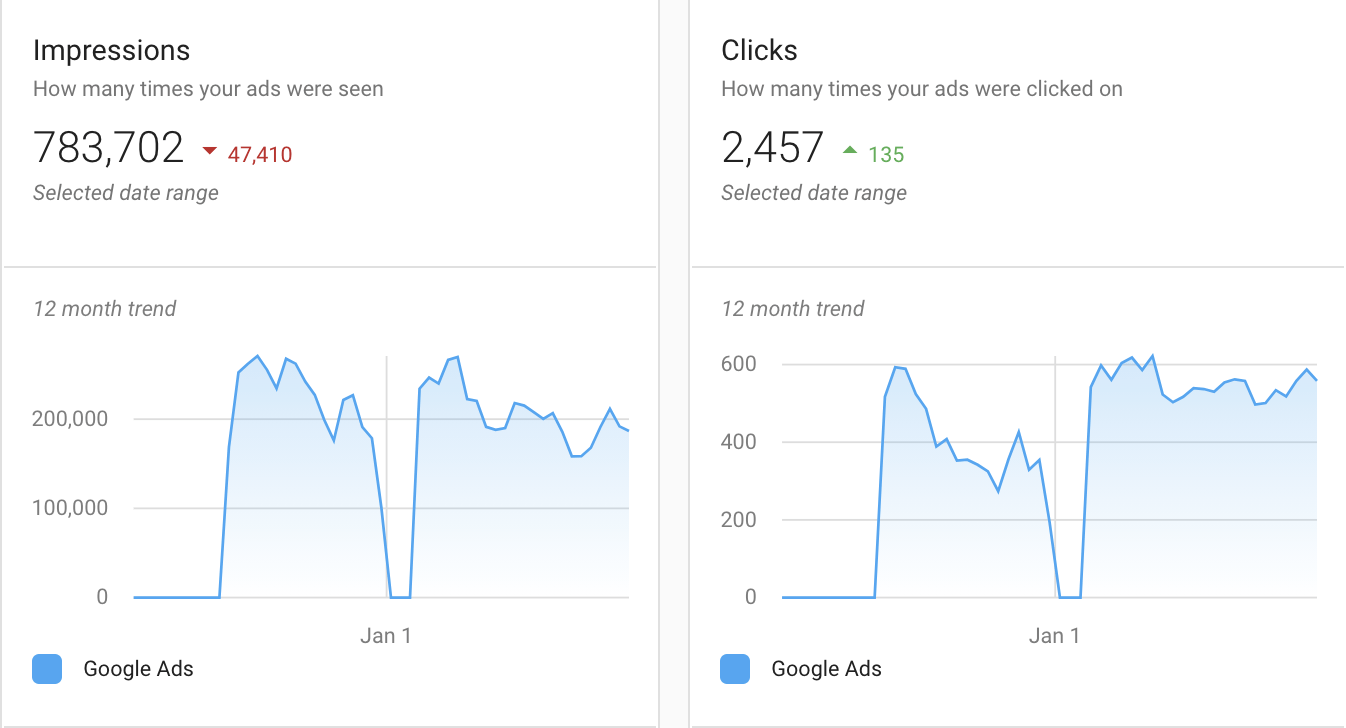
Advertising
Are you reaching everyone?
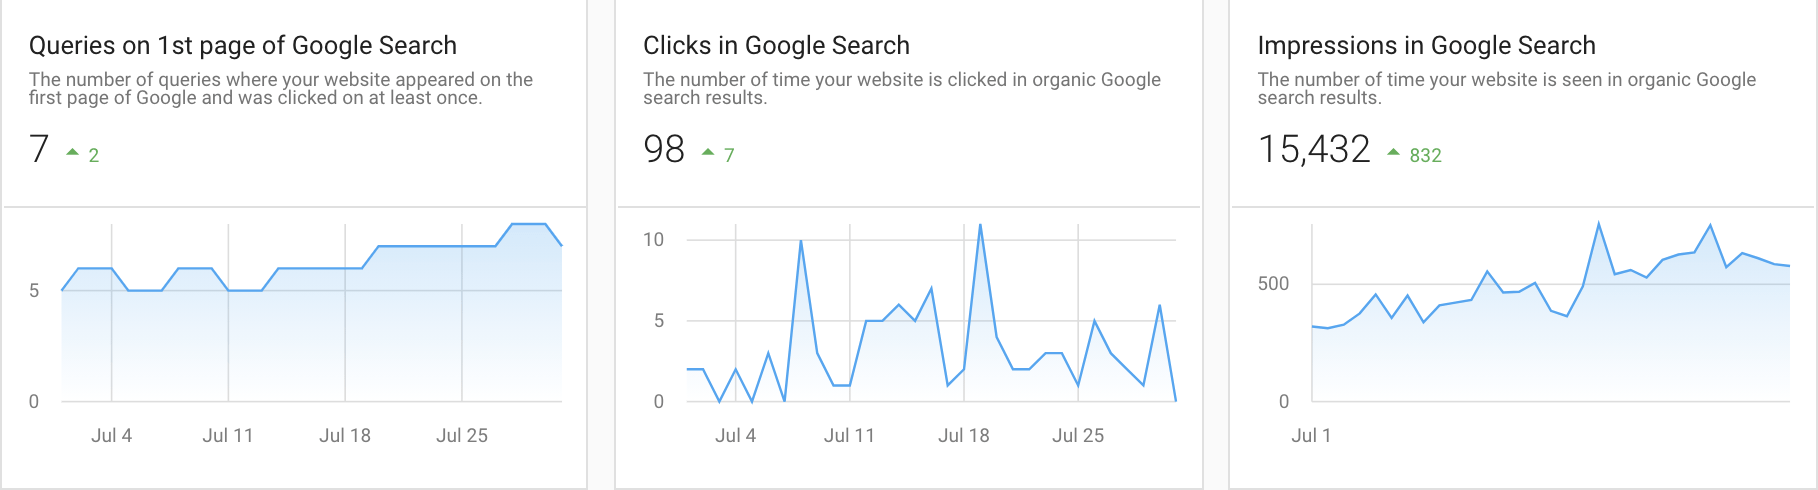
SEO
Do you show up where people are searching?